
en
Visual Thinking for Business - Make Your Point
In this video, Christoph is developing his infographic. (Best to watch it sped up by the way.)
How would your infographic about time spent look like?
Or, if you prefer, here are some different topics or points of inspiration that infographics fit well with:
An example could be the use of public transport and bicycles across Europe. Instead of working with tables and numbers, one could illustrate this comparison with bicycles in different sizes and colours on the map, representing the percentage of use.
Link:
http://www.statista.com/chart/2742/bike-sharing-schemes-how-london-measures-up/
Person figures in relation to work, food, employment, ageing, etc.: You can use person figures in order to visualise various types of content by having different sizes of the person, different colours, thickness, appearance, etc.: You could, for instance, design different shapes and body weight of babies in order to visualise eating and cooking behaviour across different countries.
Link:
http://www.heart.org/HEARTORG/GettingHealthy/HealthierKids/ChildhoodObesity/Obesity-in-Infants-and-Preschoolers-Infographic_UCM_467593_SubHomePage.jsp
Subway maps in relation to causal effects and relationship are also interesting. You can use subway maps in order to show how one step leads to another and how many different aspects are related to each other. A subway map could be used to show real estate prices and characteristics of the neighbourhood (safety, parks, shopping opportunities, etc.): you could vary the size of the station and the colour, container, etc. to visualise these aspects.
Link:
http://dc.urbanturf.com/articles/blog/how_does_wealth_distribution_fall_along_metro_lines/6988
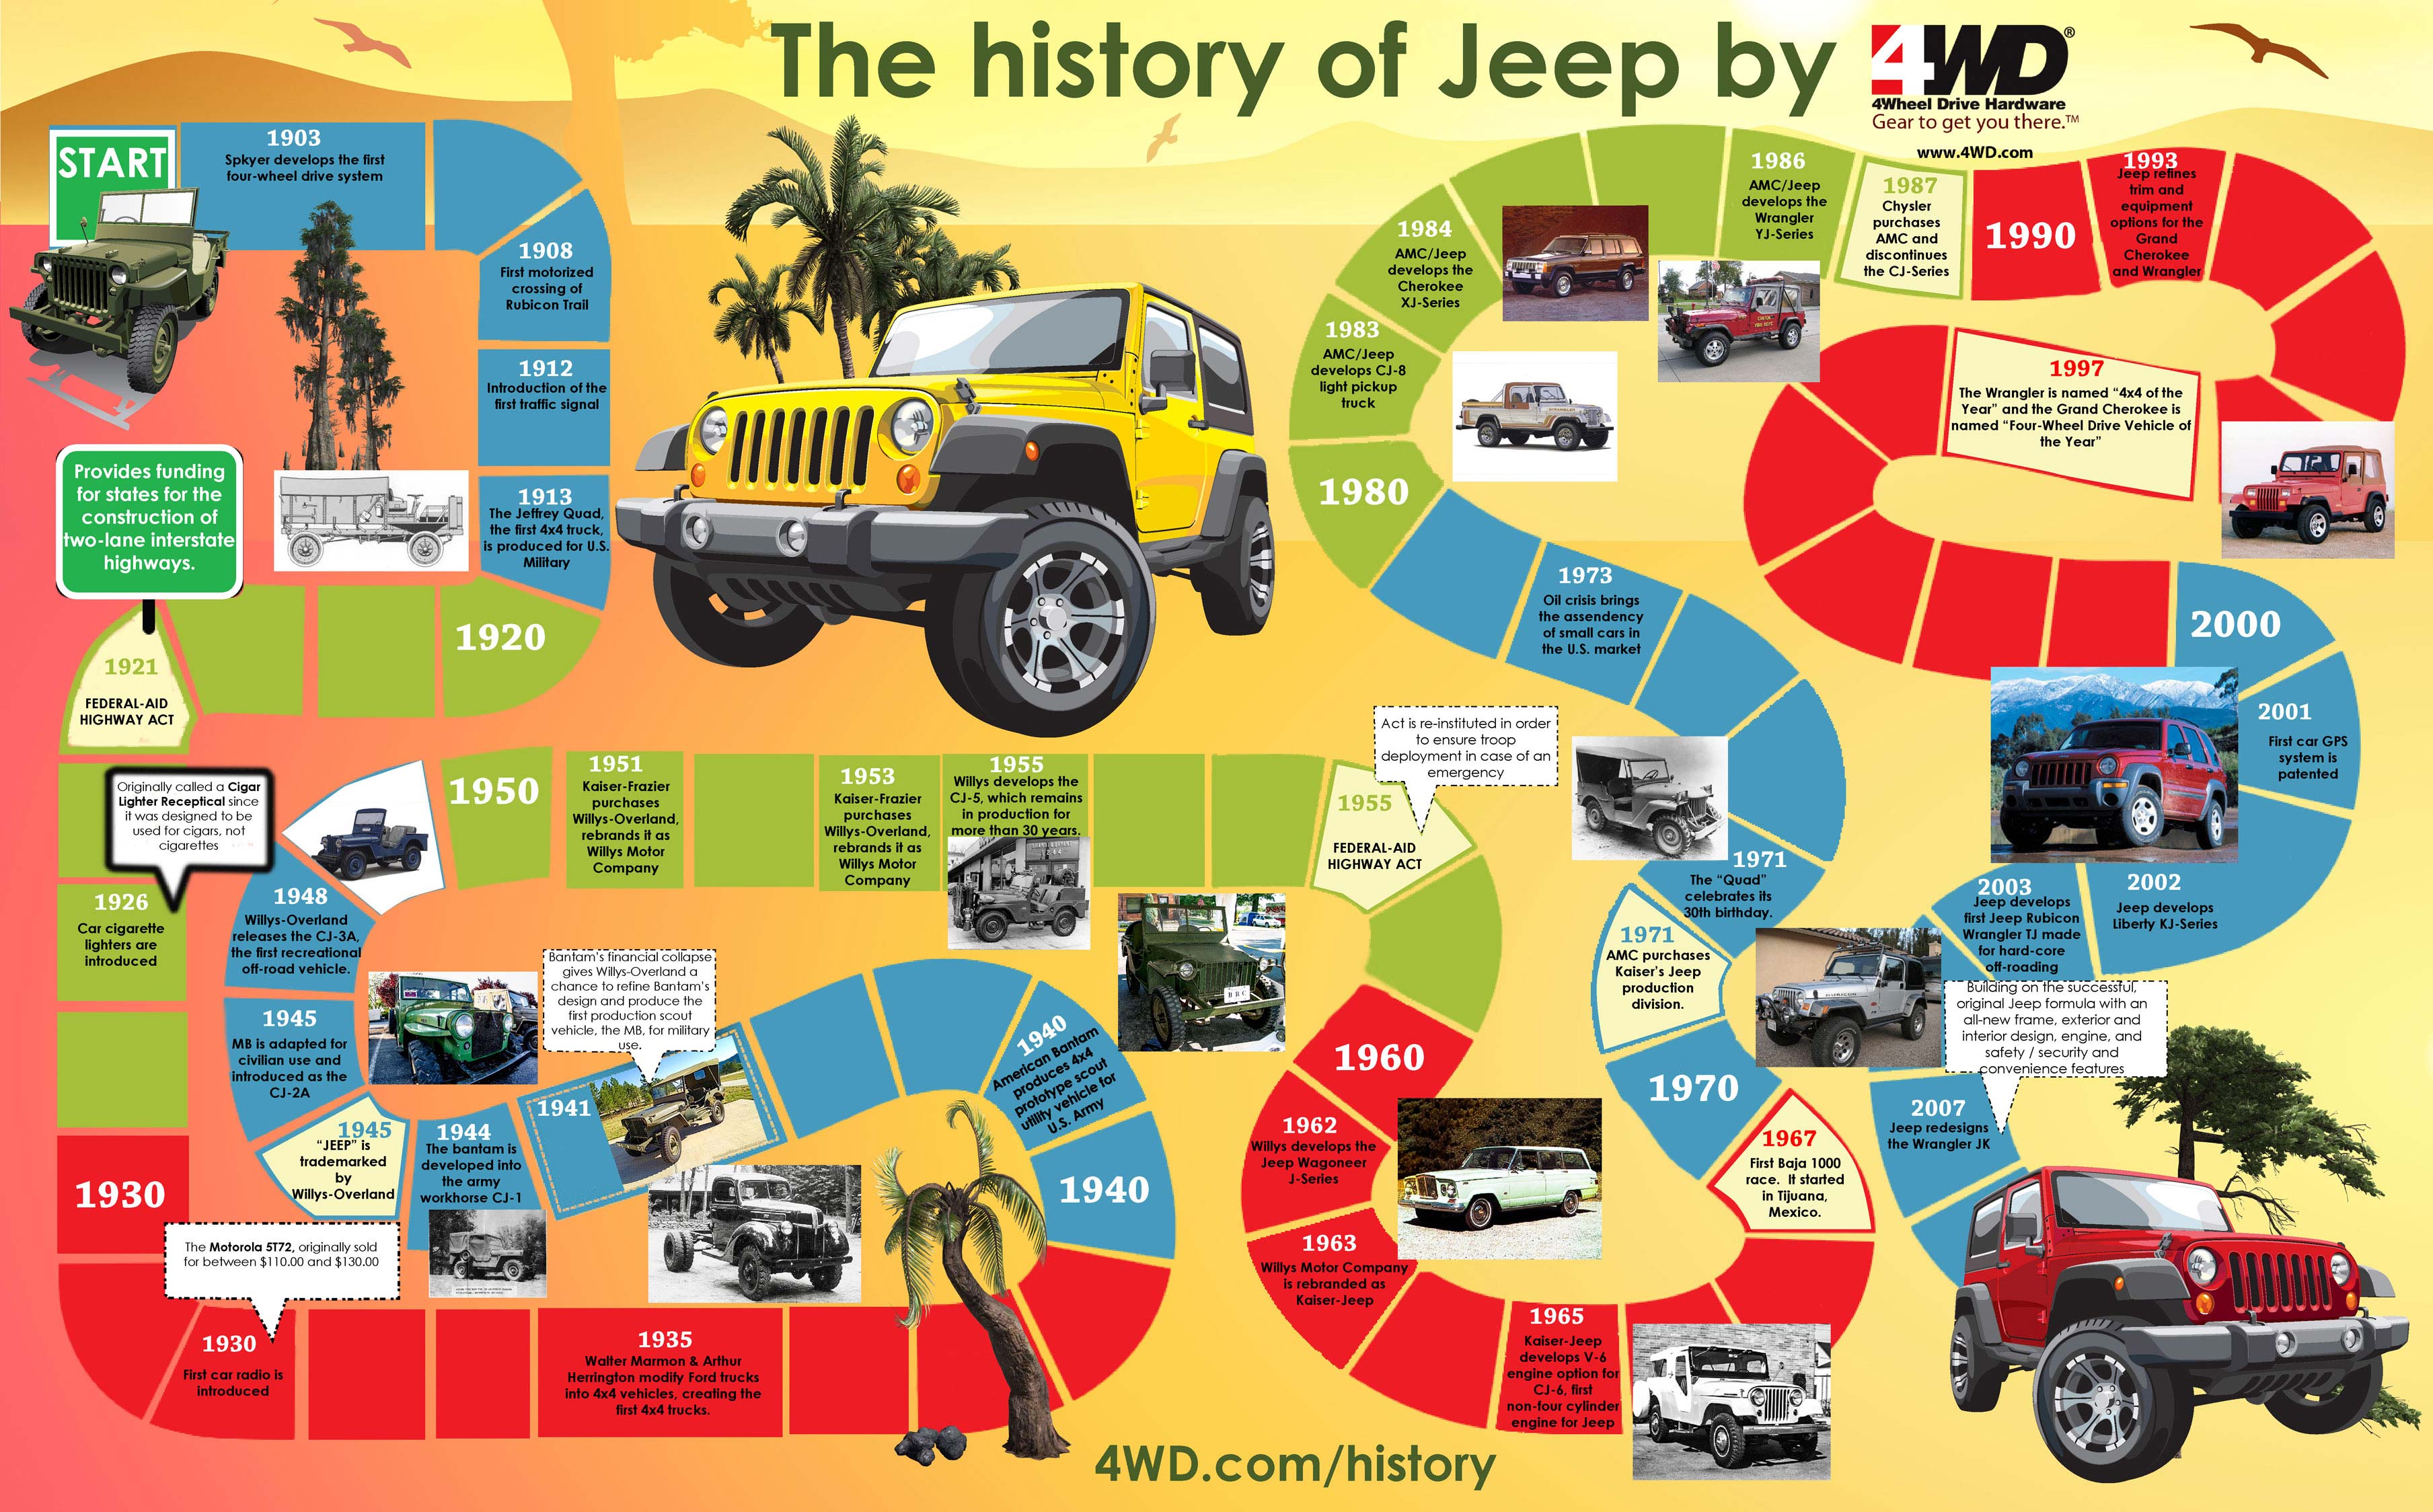
Finally, there's the example of the board game in relation to dependency paths or development over time as in the case of company history or development. You can use various visual elements to transport meaning: you can use the overall game design and background as a frame and the individual steps of the game, using colour, text and effects for more precise illustration of specific content.
Link:
http://infographicsmania.com/wp-content/uploads/2013/02/History-Of-Jeep-Infographic-infographicsmania.jpg

Anmelden mit:
very nice - much better use of space than I had!
i like the contrast between the pie structure and the more organic containers